Algorithms for MEP Design
- Sean Fruin

- May 25, 2019
- 19 min read

The AEC industry ranks among the lowest in productivity growth, the highest in stress related health issues, and has not evolved on a par with the technological standards of other industries. The demand for shelter and energy is only going to rise, meaning that the AEC industry has some significant problems. Ernestine has been quoted saying,” We can't solve problems by using the same kind of thinking we used when we created them.” This quote encompasses what we are going to cover in this class. Many technologies are converging and letting us solve problems in new ways. We can now tackle issues that were thought impossible just a few years ago. Allowing MEP engineering to let data and computer power drive the design, we can work smarter by building algorithms to take care of some of our problems and freeing us up to focus on the things that matter.

In mathematics and computer science an algorithm is a set of steps to solve a class of problems and an MEP design is just that. By linking all the design steps together, a computer can "execute" a program, following each step mechanically to accomplish the end goal. The goal of today’s demonstration is to build a Revit HVAC Air side system using a set of algorithms. The traditional skillset of an is not enough. We need a new mindset, we need skills and tools that revolve around data science. Data science is a multi-disciplinary field that uses scientific methods, processes, algorithms and systems to extract knowledge and insights from data in various forms. By using these methodologies on Building Information Models, we can revolutionize the way designers go about the design process. The age of algorithms is here and will make it possible to generate thousands of potential design options, ensure data quality, and dramatically improve efficiency.

The simplest way for AEC industry professionals to start working in this new manner is to use Dynamo, a visual programming tool used to define relationships, create algorithms that then can be used to generate geometry in 3D space, and to process data. It connects seamlessly to Revit allowing users to build algorithmic workflows within a BIM environment by linking element parameters together and using computer programing logic.


When approaching a problem in this way it is necessary to have a clear end goal. We then work backwards to figure out what is needed in order to achieve the goal, which usually involves solving several smaller problems that come together to produce the overall solution. Andrew Duncan and Andrei Capraru had a beautiful metaphor for this in their Autodesk University presentation “An MEP Engineer’s Guide to Dynamo.” They compared building algorithms to cooking a meal. Using their diagram below, let’s take a look at cooking our own meal. We start by selecting the meal we want to make, i.e. our end goal. Next, we pick out the ingredients that we will need, i.e. our data. Unless we are making Macaroni and Cheese, we will need to chop, measure, and mix our ingredients together. Think of data as our ingredients and tools like Dynamo as a Swiss Army Knife type of appliance that automates the chopping, measuring, mixing and cooking.
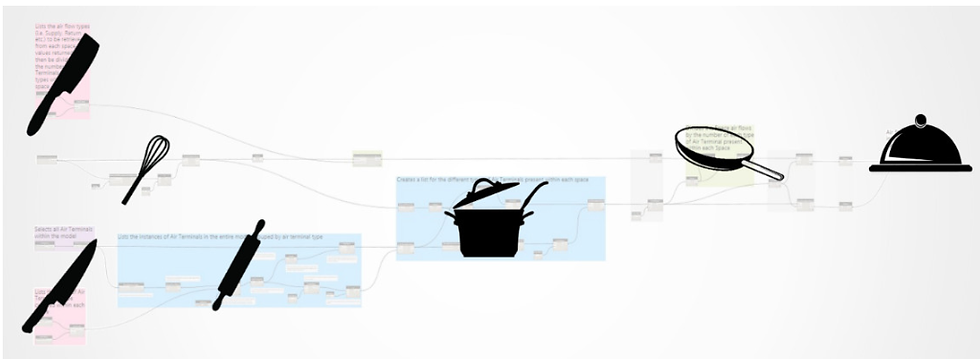
For the design of an HVAC system, the end goal is to select and link all the necessary components needed to build a system that supplies the right conditions to meet human comfort, as well as code requirements, for a given building. The best design is an optimal balance of contradicting constraints. The three most important constraints are upfront costs, lifecycle costs and energy efficiency. The inputs for this problem come from three sources: the building code requirements, the architectural model geometry, and HVAC Load calculations.

Before we start diving into building algorithms for HVAC design it is key to understand some fundamentals. First the “I” in BIM is more important than the “M,” meaning data is the most important asset a project has. If your projects consist of stacks of paper with important information peppered throughout, you are doing it wrong and will not succeed in any automation efforts.

The project needs to have a structured database. In order to have a relational database, we need to have an organized collection of data. Data in these databases will be connected to common keys. These relationships allow data to be retrieved, grouped, manipulated, updated or removed.
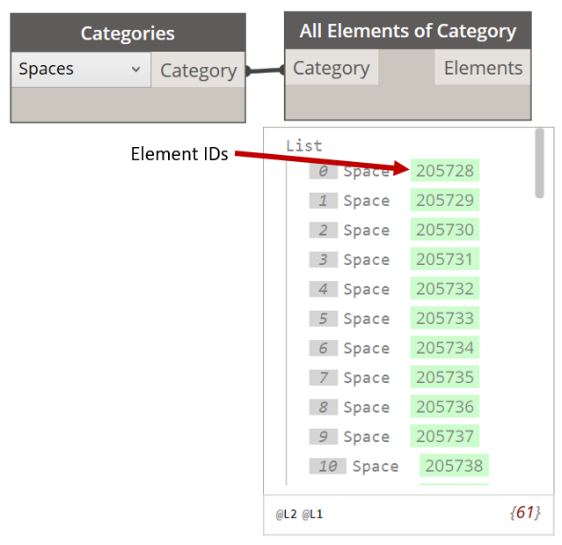
A great example of this is the Revit “Element ID.” That parameter is there to serve as the Primary Key in the background of Revit. The Primary Key in a relational database is a unique identifier for each record. Like a driver’s license number, a relational database must always have one, and only one, primary key. Most designers already use this idea in the naming conventions of mechanical equipment.

For example, take an RTU and VAV. The “RTU Number” is the primary key. The VAV then has a column for “RTU ID”. That parameter is used as the foreign key. It is this relationship that allows Dynamo to connect elements together. Notice the parameters that have the KEYS above them. Those are the values that will be used to filter and sort data throughout the algorithms.
The second key concept is the idea of parametric modeling. The goal is to build a model that is flexible and can adapt to changes. This modeling process is built from mathematical equations and setting limits using logical statements like “if-statements”. For example, take the diffuser family shown. The families are set up to change the shape of the model’s geometry immediately after the flow rate value is modified. The size is determined by a simple function using if-statements. This modeling process defines a set of goals and constraints for a project and then lets the software generate possible solutions.
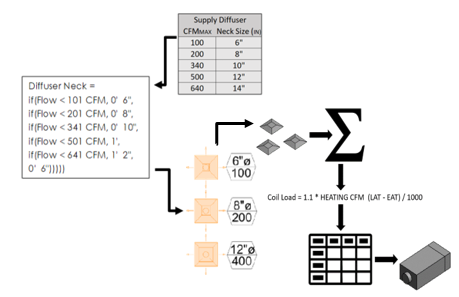
Parametric Revit Families will make your life a lot easier. Revit file sizes will decrease since one family can adapt to many conditions. The diagram on the right is an example of taking a standard Diffuser sizing chart and turning it into a parametric family. Revit families are also a good spot to store engineering equations. With Dynamo and our key, we can group elements together and collect data for calculation without needing a fully connected Revit system. Now that data can flow freely, allowing us to create algorithms.
Autodesk Insight
With keeping the end goal in mind, let’s look at Autodesk Insight, an energy modeling add-in for Revit. Insight is an impressive example of what algorithms can do and gives us a glimpse of the future of design. This platform eliminates the first bottleneck in HVAC design- manual load calculations. By uses cloud computing, an energy model can be computed at unbelievable speeds.
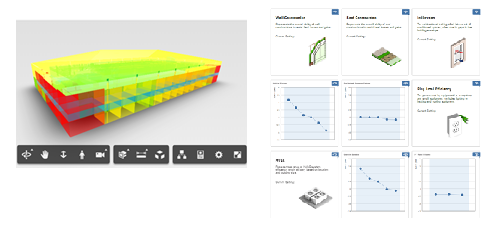
The output is an interactive dashboard. All teams, as well as building owners, can explore a range of design options and see the effects of varying parameters such as U values, glass performance, and lighting usage, in real time. This clear and robust understanding of the building demand at the onset of a project will lead to numerous design options and bring clarity and efficiency to the process. This is what I expect work to be more like in the future-Algorithms that eliminate the data drop and provide a clear and intuitive dashboard full of data to aid engineers in selecting an optimal design all while saving a whole lot of time…and time is money.

Data Collection
Before we can run Insight, the Revit project needs to be set up with the Link Arch Model and the energy setting defined. This information comes from a wide range of sources and software. These processes are often viewed as time-consuming and heavily prone to errors. For that reason, the bare minimum amount of data makes its way into Revit and is never utilized. Thanks to tools like Dynamo we no longer need follow this manual, wasteful method. Algorithms can be built to link applications and eliminate data drop and waste. This is vital to the process moving forward. Data is the fuel that allows the algorithms to work and this data needs to be in a centralized location.
Link Model
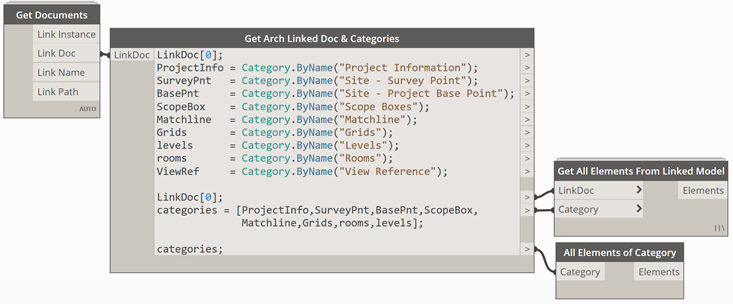
Getting access to a linked model is one of Dynamo’s most useful functions. The first script
loads and gathers all the information needed to set up the MEP model from the Architecture model. All the elements in the model can then be access and data can be retrieved from the parameters with the “Get.Documents” and “Get All Elements From Linked Model” nodes from the Archilab package.
When starting a new project, the end-user can simply execute a series of predefined scripts in Dynamo Player, automating the initial setup. This produces all the necessary sheets, views, and other project information. This data is then manipulated in a way that assigns names and numbers to our new views and sheets. We can even go a step further and automate the placement of all necessary views, schedules, and legends. Aside from saving a lot of time, the result is a uniform set of documents across various disciplines.

Setting Up Spaces
We can now use the link model to create Spaces using the “Space.ByPoints node from the Dynamo MEP package. We’ll also use the link model to set all the necessary Space parameters that come from the Architects.

Since Revit Spaces will be used for engineering calculation, it is important to make sure volumes are correct. There are a few parameters that control this value. One that will need to be edited is the “Limit Offset” parameter. This parameter is set to 8ft as the default. As we make changes to any parameter, Dynamo allows us to view the affect on the spaces in 3D. In the example below, the blue element represents the ceiling and the green elements are the space.
This methodology for collecting data from a linked model can be used for any linked model and any linked element. For example, an electrical engineer could find all the mechanical equipment in a project and grab data like voltage, horsepower, and location from the model in order to run their algorithms.
Excel Import
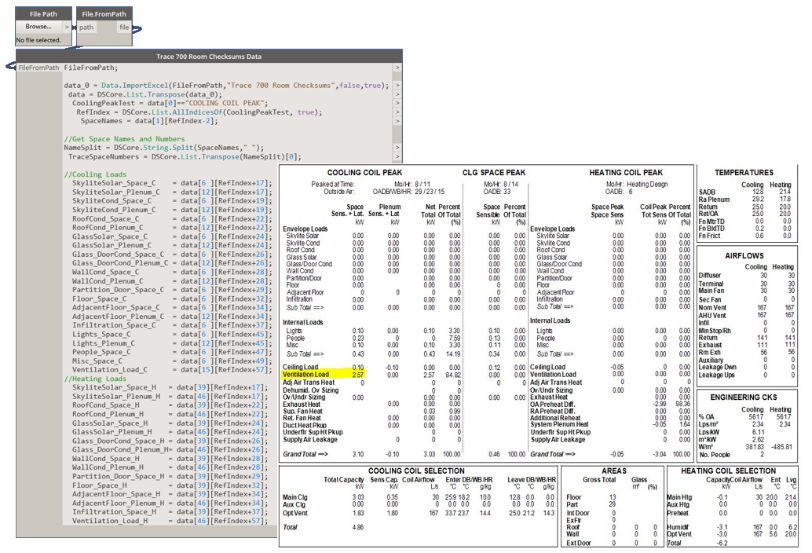
Excel is the most commonly used tool for manipulating and managing data in the MEP engineering community. We can import and export, as well as link, data to and from other applications and Excel. Linking data in Excel and Revit is extremely useful. The example below shows how data can be collected from an Excel file using the “Data.ImportExcel” node. The node needs an Excel file path and a sheet name. Most of the time it must useful to get the Excel columns into a Dynamo sublist, which can be done by simply using the “List.Transpose” node.

Most of the time the data will a little additional work in order get cleaned up. Dynamo has a lot of nodes to help manipulate the data and get it into a format that is useful. For example, let’s assume that the Excel data has headers. The “List.RestOfItems” node can be used to remove those headers. Even more flexibility can be found by changing the lacing setting on the node. For example, when we set lacing to longest on the “List.RestOfItems” node, column A is removed.

We are going to use this type of workflow in order to get all the Space load data from Insight to the Space parameters in Revit. This workflow can be adapted to eliminate manually entry from other programs like Trace 700. No more stacks of data-filled papers laying on the desk! Below is an example of the Trace 700 Room Check Sums export in Excel. These sheets house all the heating and cooling load data for each space. The output of the Dynamo graph is a list of values for each of the space’s heating and cooling load parameters. The next step would be to set these values in the project’s Revit database.
Fuzzy Logic Another issue with data integrity is related to human error and frankly, a lack of standards. An example of this is Architectural room names. MEP engineers need to match up room names to some type of key value related to building codes. A class of algorithm called fuzzy logic can aid in this process. Fuzzy logic is a form of many-valued logic in which the truth values of variables may be any real number between 0 and 1, inclusive. It is employed to handle the concept of partial truth, where the truth value may range between completely true and completely false.

There is a Dynamo package called Fuzzy Dynamo that will do the trick, comparing the room names to the list of Space type names within Revit and finding the best match. Since a space named "Womens" will never match the Ashrea look up value of "Toilet" a table is built to help link up these type of matches. The Revit space type can then be set automatically to bring in all the code data like Air Changes per Hour, Exhaust requirements and thermostat set points.

Calculations
With our Spaces and their respective parameters all set in the Revit Model, we can now calculate the required airflow within a Space. Dynamo can easily grab data from all necessary elements to compute a calculation like this and has much more flexibility than Revit in this regard. For example, using a string in logic statements to drive air flow calculation.


Another example, take the outdoor air for an AHU. This parameter is needed to perform the air requirement calculations. The script pulls this data in from the AHU element. Initially, when we first run the script, there is no “equipment” in the model to get. The script uses an “if-statement” to set these values to a default value when no match is found. Also, we are receiving these parameters without the need of a completed and fully connected Revit system.

Geometric Relationship Calculation
Calculating the air balance of the building is another task that needs to be done. The space-air transferred portion of the script uses a Generic Revit Family that is placed at the linked-model door locations. This forms relationships between spaces allowing the algorithm to balance the building properly. The family is used as an annotation showing the CFM across the door as well. The algorithm turns the visibility of this annotation off and on based on the space parameter “Design CFM Transfer”. It can also be scheduled, giving us an organized table of all air transfer relations in the building.


Data Analytics
A true BIM model is a huge database that also happens to be most effectively represented by a 3D model. One of the best ways to get a grip on a large amount of data is to use tools like Excel’s pivot charts and PowerBI. No more stacks of hard-to-digest, black and white 2D drawings. Instead, data can be explored and digested by means of statistical and visual techniques within dashboards. Dashboard are an amazing way to track progress, visually comparing data points that can help us make decisions and find anomalies.
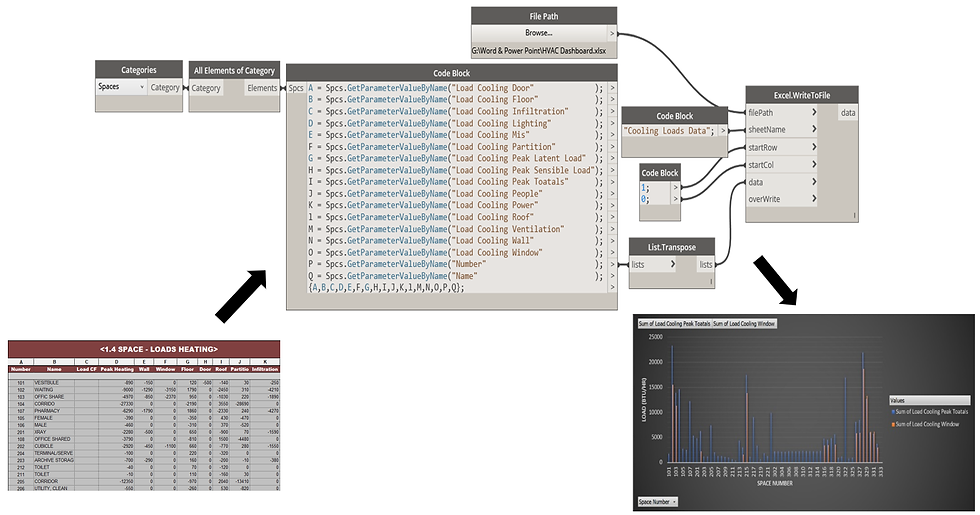
Dynamo gives us the ability to even build dashboards in a Revit Drafting View. For example, in the graph below we’re able to quickly QAQC the data before moving on. Do you see the outlier?

Another good way to look at the data is to color code the floor plans based on our Space data.

Clustering Algorithms
Now that we have a BIM model populated with a lot of trusted data, we can start to use data science in our workflow to aid in the design of our HVAC System. We will first look at clustering algorithms. Clustering is a Machine Learning technique that involves the grouping of data points. Given a set of data points, we can use a clustering algorithm to classify each data point into a specific group. There are many different types of clustering algorithms depending on what we are trying to accomplish. By combining these unsupervised Machine Learning algorithms even more complex algorithms can be formed to complete a variety of tasks.

Decision Tree
A decision tree is a support tool that uses a tree-like model with decisions linking to possible outcomes including chance event outcomes, resource costs, and utility. It is one way to display an algorithm that only contains conditional control statements.

K-Means
This algorithm groups points by a designated K number of groups. K is a number of points that is placed at the start of the algorithm.

The algorithm follows these steps-- first, it assigns points to their closest cluster center (k) according to the distance formula. Second, it calculates the new centroid of all points in each cluster. Third, it moves (k) to the new centroid point. Repeat until (k) stops moving. When that happens, the algorithm has converged, and the data is grouped. Below is an example of Kmeans running in Revit . The VAV boxes act as the Ks and the diffuser are then grouped.
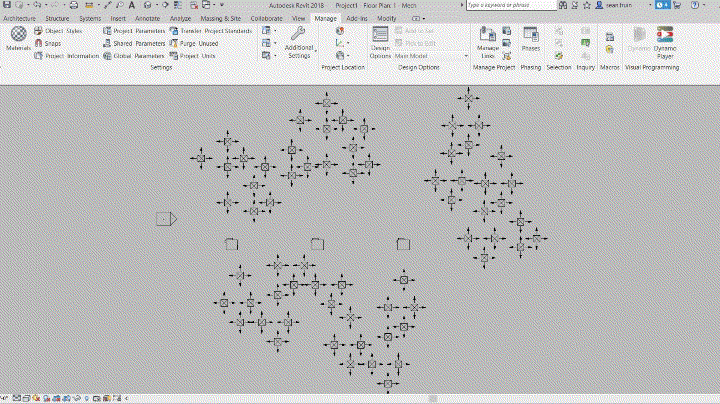
These algorithms have aspect of fuzzy logic in them. By changing the staring position of the K point you can produce different groups. This can be used to produce a verity of different results. Those results can then be ranked with a Fitness Function. A fitness function is a particular type of objective function that is used to measure how close a given design solution is to achieving its goal. The code to below is one example of the K-means algorithm. In Dynamo it’s hard to build a complex looping function. Python, on the other hand is perfect for this but out of scope for this presentation.

HVAC Zoning Algorithm
Zoning is the perfect place to start introducing these artificially intelligent and machine learning algorithms. A thermal zone is defined as an area in the building which has its own temperature control. It is important that each thermal zone is grouped with those that have the same attributes, like heating and cooling requirements, and take Space adjacency into consideration. Typical computational design techniques like line of best fit, a.k.a. linear regression, and vector calculus will not work. Those methods always have a risk of splitting a cluster in half. This is where the K-means algorithm comes in. Clusters can be seen by the eye with no problem, but the task is tricky for a computer. With Dynamo we can group spaces by attributes using a decision tree. The spaces are represented by their center points which will be fed into K-means in order to find clusters.


Now we need to split our zones among the number of Air Handling Units. We will use two Roof Top Units to keep it simple. One approach would be to split the building in half with each AHU covering half of the building. This approach may lead to one AHU having to do more work than te other since location is the only criteria. We are going to use the idea of Centre of Mass, but instead of mass we will use CFM. This gives us the smallest standard deviation in CFM between equipment. We can now assign names to the equipment, create zones, assign their respective names, and create connections.

This algorithm only scratches the surface of what is possible here. Python is needed in order to really take this to the next level. For example, by layering different algorithms we can test a variety of systems. By adding manufacturing data, fitness functions could capture the three main variables we set out to optimize at the beginning of the project- cost, life cycle cost and efficiency. With tools like Autodesk Project Refinery, the design space can be explored and optimized.

Thanks to Taco Pover and his Dynamo package MEPover, we can make these Revit Zones with an algorithm.

Computational Design Algorithms
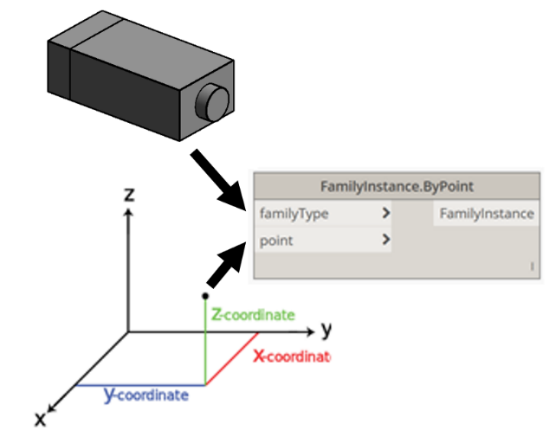
Computational Design is the application of applying computational strategies to the design process. Now that the building is zoned we can code a set of rules that the computers will follow in order to lay out all of the Mechanical Equipment. Dynamo allows you to place Revit Elements anywhere in 3D space using the “Family.Instance.ByPoint” node. We will start off with a few simple algorithms in order to place common mechanical elements.

Average Point Rule
A very simple way to get MEP elements into the model is to simply find the average point of the components it belongs to. This simple workflow will be used to place the VAV Boxes. The spaces that belong to the VAVs are grouped and the average point is found by averaging the x, y and z components of each space. Ten is added to the z component to elevate it off the floor.


Curves Based Rules
Curves offer tons of flexibility for gathering points. One way to use lines to get points is to find the intersection of lines and elements. The exhaust fans will follow the same logic as the algorithms for the VAV box except that the Z component will be retrieved by finding the intersection of the Roof and a line that starts at the Average point an extends past the Roof.
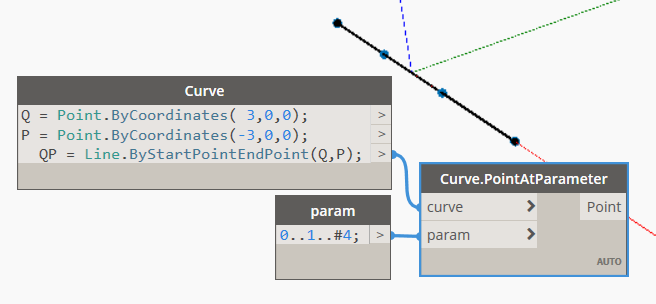
You can also get points along curves. There are multiple nodes that get points along a line. The best workflow to demonstrate this is placing Pipe hangers-- by feeding a pipe into the “element. Location” node you get a line. The length of the line will be used to calculate the number of hangers that will be needed.

Vector Rules
Points can also be moved around be adding and subtracting vectors. The VAV box thermostat can be placed near the door by first establishing an initial point inside a space, identify targets like doors, windows, corners, etc. within the space, and then moving the thermostat along the vectors. For example, the algorithm gets the first space in the zone, then finds a suitable door and makes a vector from the center of the room to the center of the door. The door’s host wall direction leads us to the next vector, the wall vector. The wall vector is then scaled to be half the width of the door, plus six inches. This point is then added to, and subtracted from, the center of the door point in order to get points to the left and the right of the door. The point closer to the space’s center point is then selected. A test line is made from the center of the space to the closer wall point so that the intersection can be found putting the point just outside the wall.

Grids Rules
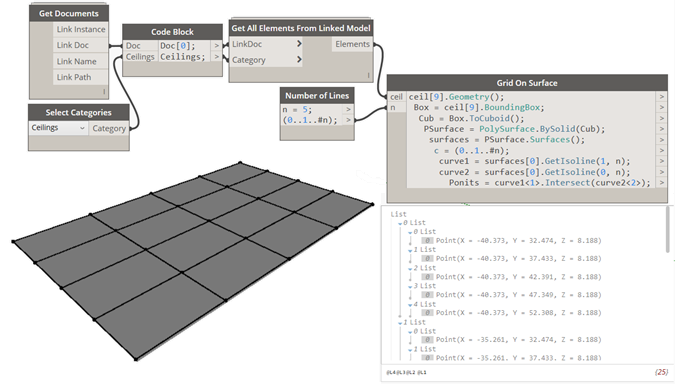
Grids can be used to get patterns of points. One way to place diffusers is to first use what we learned above in order to find the ceiling above the space. Once a ceiling is found the bottom surface of the ceiling is obtained and a grid of points can be place on the surface. The spacing can be controlled in many ways to adapt to code and building requirements.
Combinations of Geometry-Based Rules
For many situations these simple algorithms will not cut it. A combination of these rules and logical if-statements allow you to build complex computational workflows that do some cool shit! We will use a combination of rules in order to place the diffusers. The first step is to group the spaces by characteristics and then we’ll build the logic that applies to the different requirements.

The first rule applies to spaces that need to be exhausted. The space is checked for plumbing from any of the link models. If plumbing fixtures are found, then the average location is computed, and the diffuser is placed there. If not, the diffuser is placed in the center of the space.


The second rule grabs all the Corridor Spaces. Since complex shapes are hard to deal with, we compute the distance between every set of doors. The two doors with the greatest distance are selected. A vector moves those points in the space by 3ft and a Supply and Return Diffuser are placed accordingly.
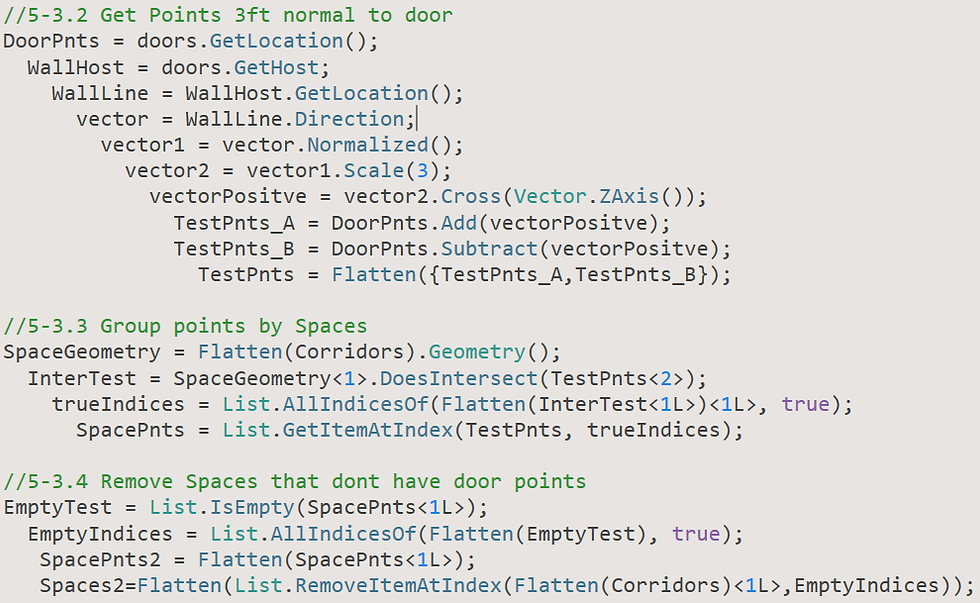

The third rule grabs smaller spaces. For these spaces we know we only need a supply and return diffuser, which should be placed in opposite corners of the space. To do this, the Space Bounding Box max and min values are used to make a line. The points are moved to the center of the space along that line by 2 ft.
The last rule of the algorithm places the diffusers for the rest of the Spaces. It uses similar methods for the grid for ceiling surface but adds rules to check for situations like a point not being in a space. These situations happen when the space is not a rectangle. The outputs to the place diffuser algorithm can be seen below. On the left we have the Dynamo graph which shows all the lines and points used to find the diffuser locations. On the right is the Revit floor plan with the diffusers placed.
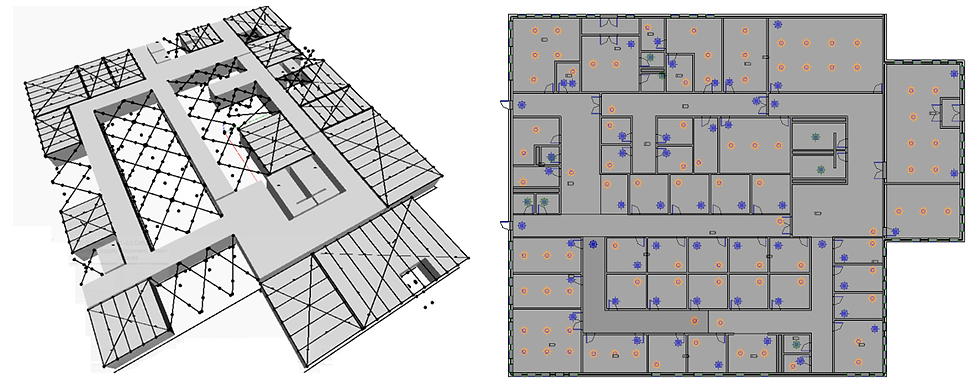
The end of the script ensures that all the diffuser get set to the linked model ceilings. Using the intersection line test from above. This section of the script could be taken out any ran any time, like when the ceilings get moved on a Friday afternoon!

Another benefit is the relationship formed between the Revit families. This is where the Relational Database comes in. This gets us to our goal of having a fully parametric model that eliminates redundancy issues and manual work.

Now that the equipment has been placed and relationships have been established, we can use Dynamo as a Database Management System. Here we will populate all mechanical equipment and diffuser CFM. We can re-open the second script. The end of this script calculates all the cfm for diffusers and mechanical equipment. This script was designed to be ran at any time and to map out the data. We group the data using the keys and then sum up the CFM. To the below is the example of the exhaust fans retrieving their CFM from the spaces.
Sometimes, the CFM divided by the number of diffusers results in a fraction. Here Dynamo can distribute the CFM using whole numbers by rounding the number of diffusers to a divisible number. Below is the code for redistributing the CFM.

With diffusers and mechanical equipment placed in a project, we can now create supply, return, and exhaust air systems to connect the components of the duct system. This step is critical for proect and data health and is often skipped by many Revit users. They just start manually drawing duct and end up with random systems. These random systems lead to useless data. To streamline the process, the next algorithm will use the MEPover package to create our systems and add the elements. The key nodes are “MEPSystems.CreateSystem” and the “Connector.AddToSystem”.
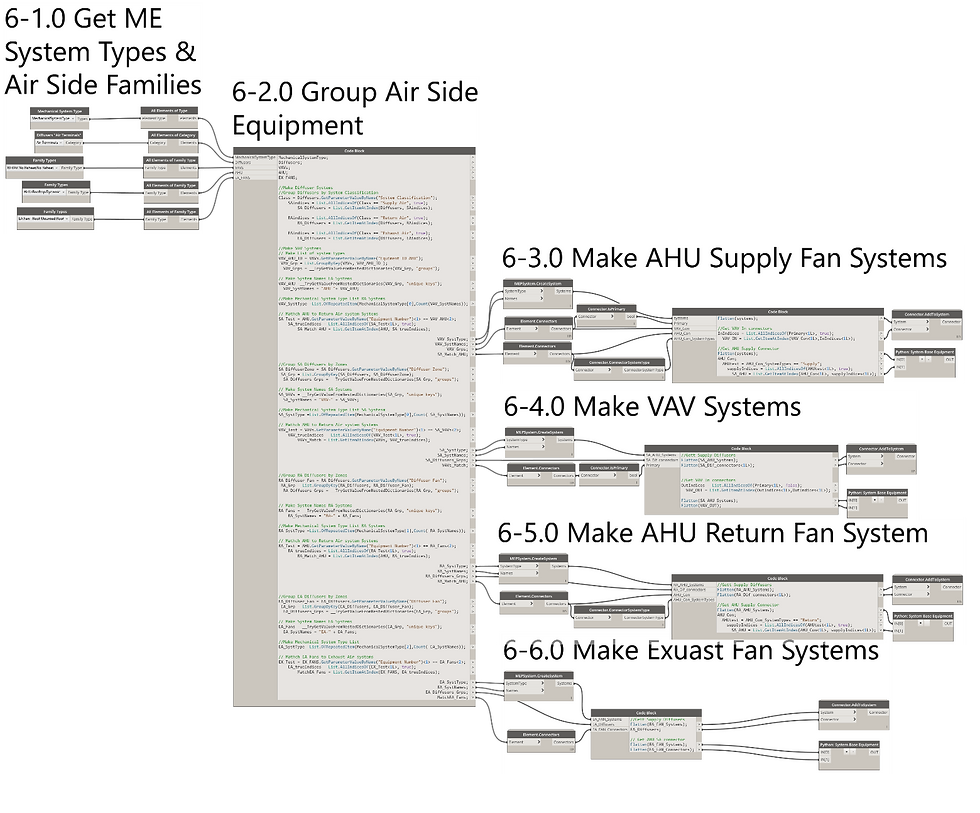
Generative Design Algorithms
By using Dynamo to build the model and set the relationships between elements we now have a parametric 3D model and a mathematical system for the HVAC design that is governed by the building’s geometry and code requirements. This model’s design space can be explored by a genetic algorithm, letting the software generate possible solutions. These solutions can then be ranked and scored by a fitness function to find the solution that best fits the stakeholder’s needs. Autodesk Project Refinery is a generative design beta for the architecture, engineering and construction industry that gives users the power to quickly explore and optimize their Dynamo designs. This process is already being used in other industry to come up with solutions that a human would never find.

Take the Autodesk and NASA’s joint effort to make a moon lander using generative design. The goal was to minimize weight and what came out is an alien look design. Next, we will explore how this generative design could be used for the next step in the design process, laying out systems. An algorithm will be built with Dynamo to parametrically produce lay out options then Project Refinery will explore and optimize all the options for one of our VAV systems. The Diffuser in the system will be fixed and we will also assume that the main HVAC line has been routed and fixed as well. These serve as the constraints in our problem. The goal of the script is to connect the VAV box to the main duct line and to connect all the diffusers to the VAV while minimizing the static pressure of the HVAC System. This is the fitness fiction. Static pressure refers to the resistance to airflow in the duct network. The higher the static pressure the harder the fan needs to work, and the more energy is needed to run the fan. First, Dynamo is used to write an algorithm that works much in the same way the Revit algorithms Generate Layout Tools is used to specify routing for ductwork and piping. That tool allows users to click though a range of options. In our example, Project Refinery will check all the design options and find the one with the lowest static pressure.
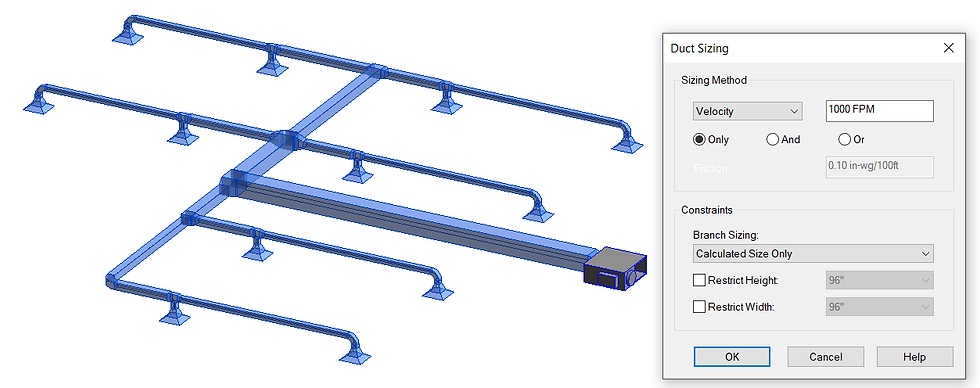
To finish things off, the last algorithm converts the lines from the routing solution into duct work using the MEPover package. The ducts are then sized, and the actual pressure drop calculation is performed using native Revit.

The constraints of the problem can be single-objective or multi-objective during the optimization process. The next steps in improving the example would be to add more constraints. Imagine adding minimizing costs as another objective while also increasing the design space and adding more costly duct fittings that are designed to reduce the static pressure. This can be taken further, even to the manufacturing level where safety and delivery constraints can be optimized. With cloud-based computing, the power and ability to run such massive algorithms will no longer be an issue.
Conclusion
This workflow might seem like magic, but I assure you there are no tricks. The key is simply taking the time to standardize your data in order to automate your workflow. Automation ensures the validity of the data and increases the quality of the output. The workflow in this document shows that building a proper foundation and leveraging coding, automation, and data management, takes a process that could have taken weeks (possibly even months) and streamlines it into a matter of minutes. The tools discussed here are already having a substantial impact on the future of the AEC industry, and this is only a first step towards the revolution of building design. The industry is on the brink of a tipping point. Machine learning and Generative Design algorithms will generate and optimize thousands of design options in a matter of minutes, freeing engineers to solve more important problems. The industry is held back due to a lack of understanding of the importance of the “I” in “BIM” and a preference to hold on to a drafting mentality rather than embracing the power of parametric modeling. We’re too busy pushing ahead with our cart and its squared wheels to realize that a few minutes spent rounding the wheels will get us further, faster!


Comments